Univariate Data and Bivariate Data
|
Student: What is bivariate data? Mentor: Bivariate data is data that involves two different variables whose values can change. Bivariate data deals with relationships between these two variables. The purpose of bivariate data is to analyze and explain this relationship. Student: Is all data bivariate? Mentor: Actually, some data has only one variable. For example, if I were to record the ages of all students in a school and graph my data, then there would only be one variable, the age of the students. This type of data is known as univariate data and it does not deal with relationships, but rather it is used to describe something. In this example univariate data is used to express the ages of the students in a school. Student: OK, so univariate data does not deal with relationships between two things while bivariate data does? Mentor: Yes, and since bivariate and univariate data are different, there are different ways of organizing and examining the data. Student: What do you mean by "organizing and examining the data"? Mentor: Well, for example, since univariate data has only one variable we would be interested in finding a way to summarize information for this single variable. The description of the spread of the data is one such way that would help us to better understand the data. The spread of a data set includes the range, median, upper and lower quartiles that divide the data into four equal sizes, maximum value and minimum value. How do you think understanding spread would be useful with the example I gave about finding the ages of students in a school? Student: Well, if we knew the youngest age of students in a school and the oldest age of students in a school then we would have an idea of what the ages are for all of the students in the school since each student's age would have to be equal to or between those two ages. Mentor: Exactly, it is also common to find the mean, median and mode of univariate data sets to better understand the data. The way that univariate data sets are portrayed graphically is also different from bivariate data sets. If I wanted to express a univariate data set what kinds of representations and graphs do you think that I could use? Student: Well, if finding the median, the quartiles and the range helps us understand the data then maybe a box plot would be useful so we could clearly portray that information. However, a box and whisker plot would only graph the relationship of all of the data together. If I wanted to compare the amount of students of each age to the amount of students of the other ages then maybe a bar graph or a pie graph would be helpful. Mentor: Yes! Those are several of the many ways to portray univariate information. Now let's switch our thinking to bivariate data. Since bivariate data includes two variables, and it is used to examine the relationship between these variables, how do you think we would want to organize and examine this data? How would you organize the data if one variable represents the amount of hours you studied for a test and the other variable represents the grade that you received on the test? Student: Well, maybe you could make a table with two rows. On the top row you could record the number of hours studied and on the bottom row the grades that you received, like this:
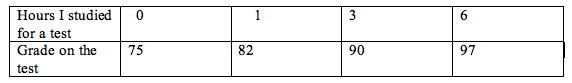
This way you could see if there is any relationship between the bottom row of variables as the first row of variables increase. In fact, you could graph this on a coordinate plane if you label one variable x and the other variable y! If I recorded the data of how many hours I study for a test in comparison to what grade I make on the test I could have a result such as the following data set: {(3 hours, 90) (1 hour, 82) (6 hours, 97) (0 hours, 75)}. Mentor: Good job! You thought of both a visual and a numerical way of organizing and examining the bivariate data. Both of those ideas could definitely help you understand the data in a bivariate set. In fact, the graph that you described is commonly used in order to observe a relationship between data. It is called a scatter plot. If you would like to explore bivariate data sets more then you can use the Regression Activity to observe the correlation. Now, we just learned a lot of information, can you sum up what we learned are the differences between bivariate and univariate data? Student: OK, we learned that bivariate data has two variables while univariate data has one variable. We also learned that bivariate data involves relationships between the two variables, while univariate data involves describing the single variable. We also discussed that information we would gather from bivariate data would be about the correlation between variables, while the information we would gather from univariate data would be about its distribution, such as the range and the mean. Lastly, we discussed that univariate data can be represented in many ways including a bar graph or a box and whisker plot, while bivariate data is commonly represented in a scatter plot. Overall, we realized that there are many differences between bivariate and univariate data! |
