Outliers
|
Student: What is an outlier? Mentor: An outlier is defined as a value far from most others in a set of data. For example, given the following points: {(1,0) (2,2) (3,3) (4,5) (5,5) (7,6) (7,7) (8,1)}, which point do you think is the outlier? It might be clearer if we graph them:
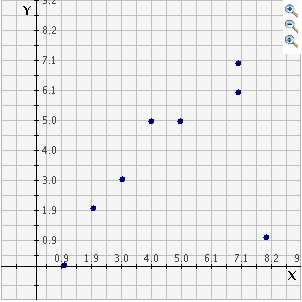
Student: Well all of those points would almost form a straight, diagonal line except for (8,1) which seems far from most other points like the definition of an outlier says. Mentor: Good job! An outlier can cause problems if you're trying to draw conclusions from your data. Student: What kind of conclusions? Mentor: With graphs that use coordinates like this one, we often try to see if there is a relationship between the x and y values which can be shown by the line of best fit. So, if we graphed the line of best fit for these points it would look like this:
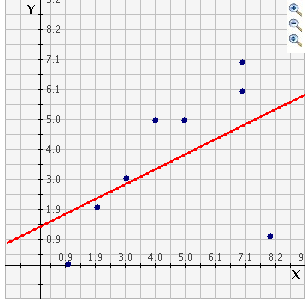
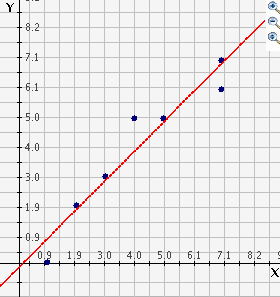
Student: I would have thought the line would touch more of the points. Mentor: Exactly. It looks like this because of the outlier. The outlier is causing the slope of the line of best fit to be less steep than you might expect. If we take out the outlier, (8,1), here is what the graph would look like:
Student: I can see that the outlier was affecting the line. Mentor: Another conclusion that can be drawn from data is the mean, which is also affected by outliers. Lets look at an example. We will look at the heights of a group that includes five 2nd grade students and their teacher. Their heights in inches are: 48" 46" 48" 50" 44" and 72". Student: The teacher's height is an outlier. It isn't even close to the other heights. Mentor: Good. Can you graph that on a number line?
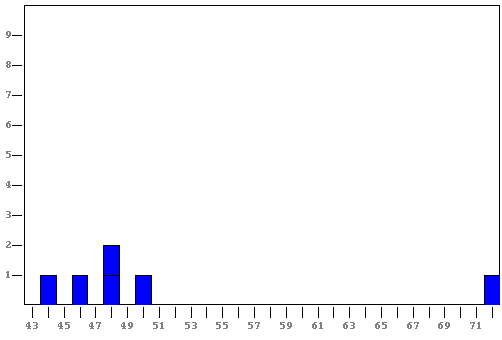
Mentor: Good. Now you can see how far the outlier is from the rest of the data. As I said earlier, outliers can affect the mean. What is the mean of this data? Student: Well, to find the mean, I add all of the heights together (which equals 308) and divide by the number of people (there are 6 people) so the mean is about 51". Mentor: Do you think 51" represents their heights well? Student: No, the tallest student is only 50" so 51" doesn't represent the heights of the students well. Mentor: That is right. The 72" is influencing the mean. Lets calculate the mean without the teacher's height. Student: Alright, I add the heights together, which equal 236, and divide by the number of people, which is 5, so the mean is about 47". That represents the heights of the entire group better. Mentor: Yes, 47" is a more clear portrayal of the data. So now you know if you have an outlier you probably need to examine your data closely to understand if you should choose to keep it in your data analysis or not. |
