Bar Graph
|
Student: What do you use bar graph for? Mentor: Bar graphs compare measurements of different values. Student: Why do you need a graph? Why can't you just use numbers or tallies? Mentor: Well, with a bar graph we can look quickly at the graph and know some important information about the data. Student: What kind of information? Mentor: Lets look at a bar graph and see if you can tell. Lets look at different hair colors in a classroom of twenty students.
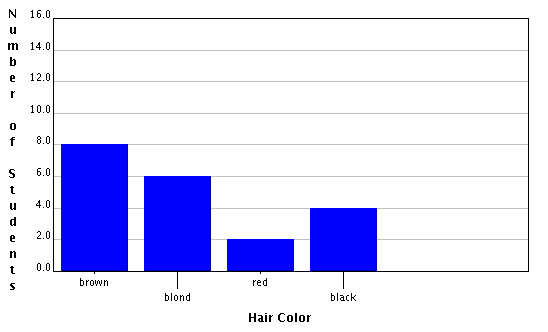
Mentor: So what do we find from this chart? Student: There are more students with brown hair than any other color and red hair is the least common hair color. Mentor: Good! So without knowing that there are exactly 8 brunettes and 2 redheads, you know the most and least common colors. What other information can you tell? Student: None of the bars are the same height, which means there are different amounts of people with each hair color. None of the bars are higher than 8, which means that there is no hair color that more than 8 people have. None of the bars are shorter than 2, which means at least two students have each hair color. Mentor: Right, these are all things that a bar graph can tell as at a quick glance; it would take much longer to find out all of this information using tallies or numbers. Student: I see now why bar graphs are used so often! |
